One of the problems developers encounter as their microservice apps grow is tracing requests
that propagate from one microservice to the next. It can quite daunting to try
and figure out how a requests travels through the app, especially when you may
not have any insight into the implementation of the microservice you are calling.
Spring Cloud Sleuth is meant to help with this exact problem. It introduces unique
IDs to your logging which are consistent between microservice calls which makes
it possible to find how a single request travels from one microservice to the next.
Spring Cloud Sleuth adds two types of IDs to your logging, one called a trace ID and the other called a span ID. The span ID represents a basic unit of work, for example sending an HTTP request. The trace ID contains a set of span IDs, forming a tree-like structure. The trace ID will remain the same as one microservice calls the next. Lets take a look at a simple example which uses Spring Cloud Sleuth to trace a request.
Start out by going to start.spring.io and create a new
Spring Boot app that has a dependency on Sleuth (spring-cloud-starter-slueth).
Generate the project to download the code. It is good practice to give your application
a name and also necessary to have meaningful tracing from Sleuth. Create a file called bootstrap.yml in src/main/resources. Within that file
add the property spring.application.name and set it to whatever you would like to
call your application. The name you give your application will show up as part of the
tracing produced by Sleuth.
Now lets add some logging to your application so you can see what the tracing will
look like. Open the application file for your application (where the main method is)
and create a method called home which returns a String.
public String home() {
  return "Hello World";
}
Lets have this method called when you hit the root of your web app. Add the
@RestController annotation at the class level, and then add @RequestMapping("/")
to your home method.
@SpringBootApplication
@RestController
public class SleuthSampleApplication {
	public static void main(String[] args) {
		SpringApplication.run(SleuthSampleApplication.class, args);
	}

	@RequestMapping("/")
	public String home() {
		LOG.log(Level.INFO, "you called home");
    return "Hello World";
	}
}
If you start the app at this point and hit http://localhost:8080 you should see
Hello World returned. Up until this point all we have is a basic Spring Boot app.
Lets add some logging to our app to see the tracing information from Sleuth.
Add the following variable to your application class.
private static final Logger LOG = Logger.getLogger(SleuthSampleApplication.class.getName());
Make sure you change the application class name to whatever your application class name is.
In your home method add the following log statement.
@RequestMapping("/")
public String home() {
  LOG.log(Level.INFO, "you called home");
  return "Hello World";
}
Now if you run the application and hit http://localhost:8080 you should see
your logging statement printed in the console.
2016-06-15 16:55:56.334 INFO [slueth-sample,44462edc42f2ae73,44462edc42f2ae73,false] 13978 --- [nio-8080-exec-1] com.example.SleuthSampleApplication : calling home
The portion of the log statement that Sleuth adds is [slueth-sample,44462edc42f2ae73,44462edc42f2ae73,false].
What do all these values mean? The first part is the application name (whatever you set spring.application.name to in
bootstrap.yml). The second value is the trace id. The third value is the span id. Finally the last value
indicates whether the span should be exported to Zipkin (more on Zipkin later).
Besides adding additional tracing information to logging statements, Spring Cloud Sleuth also provides some important benefits when calling other microservices. Remember the real problem here is not identifying logs within a single microservice but instead tracing a chain of requests across multiple microservices. Microservices typically interact with each other synchronously using REST APIs and asynchronously via message hubs. Sleuth can provide tracing information in either scenario but in this example we will take a look at how REST API calls work. (Sleuth also supports other microservice communication scenarios, see the documentation for more info.)
A simple example to see how this works is to have our application call itself
using a RestTemplate. Lets modify the code in our application class to do
just that.
private static final Logger LOG = Logger.getLogger(SleuthSampleApplication.class.getName());

@Autowired
private RestTemplate restTemplate;

public static void main(String[] args) {
SpringApplication.run(SleuthSampleApplication.class, args);
}

@Bean
public RestTemplate getRestTemplate() {
    return new RestTemplate();
}

@RequestMapping("/")
public String home() {
LOG.log(Level.INFO, "you called home");
    return "Hello World";
}

@RequestMapping("/callhome")
public String callHome() {
LOG.log(Level.INFO, "calling home");
    return restTemplate.getForObject("http://localhost:8080", String.class);
}
Looking at the code above the first thing you might ask is “Why do we have a
RestTemplate bean?” This is necessary because Spring Cloud Sleuth adds the
trace id and span id via headers in the request. The headers can then be used by
other Spring Cloud Sleuth enabled microservices to trace the request. In order to do this, the starter
needs the RestTemplate object you will be using. By having a bean for our RestTemplate
it allows Spring Cloud Sleuth to use dependency injection to obtain that object
and add the headers.
We have also added a new method and endpoint called callhome which just makes a request
to the root of the app.
If you run the app now and hit http://localhost:8080/callhome you will see 2 logging statements appear in the console that look like.
2016-06-17 16:12:36.902  INFO [slueth-sample,432943172b958030,432943172b958030,false] 12157 --- [nio-8080-exec-2] com.example.SleuthSampleApplication      : calling home
2016-06-17 16:12:36.940  INFO [slueth-sample,432943172b958030,b4d88156bc6a49ec,false] 12157 --- [nio-8080-exec-3] com.example.SleuthSampleApplication      : you called home
Notice in the logging statements that the trace ids are the same but the span ids are different. The trace ids are what is going to allow you to trace a request as it travels from one service to the next. The span ids are different because we have two different “units of work” occurring, one for each request.
If you open your browsers debug tools and look at the headers for the request
to /callhome you will see two headers returned in the response.
X-B3-SpanId: fbf39ca6e571f294
X-B3-TraceId: fbf39ca6e571f294
These headers are what allows Sleuth to trace requests between microservices.
While this is a very basic example you can easily imagine how this would work similarly if one Sleuth enabled app was calling another passing the trace and span ids in the headers.
If you are using Feign from Spring Cloud Netflix, tracing information will also be added to those requests. In addition Zuul from Spring Cloud Netflix will also forward along the trace and span headers through the proxy to other services.
Zipkin
All this additional information in your logs is great but making sense of it all can be quite cumbersome. Using something like the ELK stack to collect and analyze the logs from your microservices can be quite helpful. By using the trace id you can easily search across all the collected logs and see how the request passed from one microservice to the next.
However what if you want to see timing information? You could certainly calculate
how long a request took from one microservice to the next but that is quite a pain to do
yourself. The good news is that there is a project called Zipkin which can help us out.
Spring Cloud Sleuth will send tracing information to any Zipkin server you point it
to when you include the dependency spring-cloud-sleuth-zipkin in your project.
By default Sleuth assumes your Zipkin server is running at http://localhost:9411. The location can be configured by setting
spring.zipkin.baseUrl in your application properties.
We can use Zipkin to collect the tracing information from our simple example above.
Go to start.spring.io and create a new Boot project that has the
Zipkin UI and Zipkin Server dependencies. In the application properties file for this
new project set server.port to 9411. If you start this application and head to
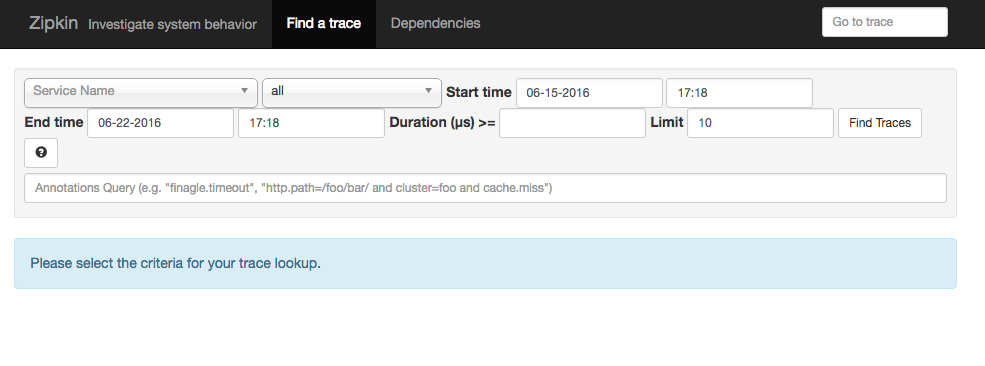
http://localhost:9411 you will see the Zipkin UI. Of course there aren’t any applications
sending information to the Zipkin server so there is nothing to show.

Lets enable our sample Sleuth app from above to send tracing information to our Zipkin server. Open the POM file and add
<dependency>
    <groupId>org.springframework.cloud</groupId>
    <artifactId>spring-cloud-sleuth-zipkin</artifactId>
</dependency>
In addition we need to tell our application how often we want to sample our logs to
be exported to Zipkin. Since this is a demo, lets tell our app that we want to sample
everything. We can do this by creating a bean for the AlwaysSampler. Add the following
code to your application class.
@Bean
public AlwaysSampler defaultSampler() {
  return new AlwaysSampler();
}
Once you add the sampler bean, restart the application. If you now hit
http://localhost:8080/callhome in your browser you should notice that the export
flag in the sleuth logging has changed from false to true.
2016-06-20 09:03:44.939  INFO [slueth-sample,380c24fd1e5f89df,380c24fd1e5f89df,true] 19263 --- [nio-8080-exec-1] com.example.SleuthSampleApplication      : calling home
2016-06-20 09:03:44.966  INFO [slueth-sample,380c24fd1e5f89df,fc50a65582b7b845,true] 19263 --- [nio-8080-exec-2] com.example.SleuthSampleApplication      : you called home
This indicates that the tracing information is being sent to your Zipkin server.
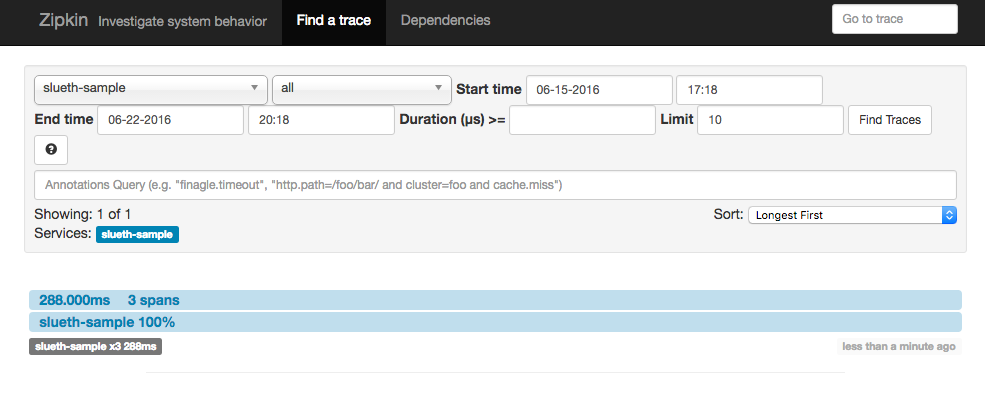
If you open another browser tab and go to http://localhost:9411 you should see the Zipkin
UI. From here you can query Zipkin to find the tracing information you are looking for.
Make sure you set the date range correctly and click Find Taces. You should see
tracing information for the /callhome endpoint returned. Clicking on it will show
you all the details collected from the Sleuth logs including timing information for the
request.


If you want to learn more about Spring Cloud Sleuth, I suggest you read through the documentation. There is lots of good information in the docs and it contains a ton of additional information for more complicated use cases.